The City of Toronto has an Open Data Portal that was first founded in the fall of 2009. I decided to search through it and found a GEOJSON file containing the boundaries of City of Toronto Neighborhoods. This file contained a lot of information including the names, areas, longitude, latitude and geometry of the 150 neighborhoods in the City of Toronto.
FROM GEOJSON TO GEOPANDAS:
Using Python, I converted the GEOJSON file to a GEOPANDAS dataframe. The geometry column stores the boundaries or coordinates of each of the 150 neighborhoods as Polygons. I was able to generate a plot of all 150 neighborhoods. I also took it one step further and annotated each neighborhood with its corresponding name. The following is the annotated plot of the 150 neighborhoods in the City of Toronto obtained from the GEOJSON file found in Toronto's Open Data Portal.
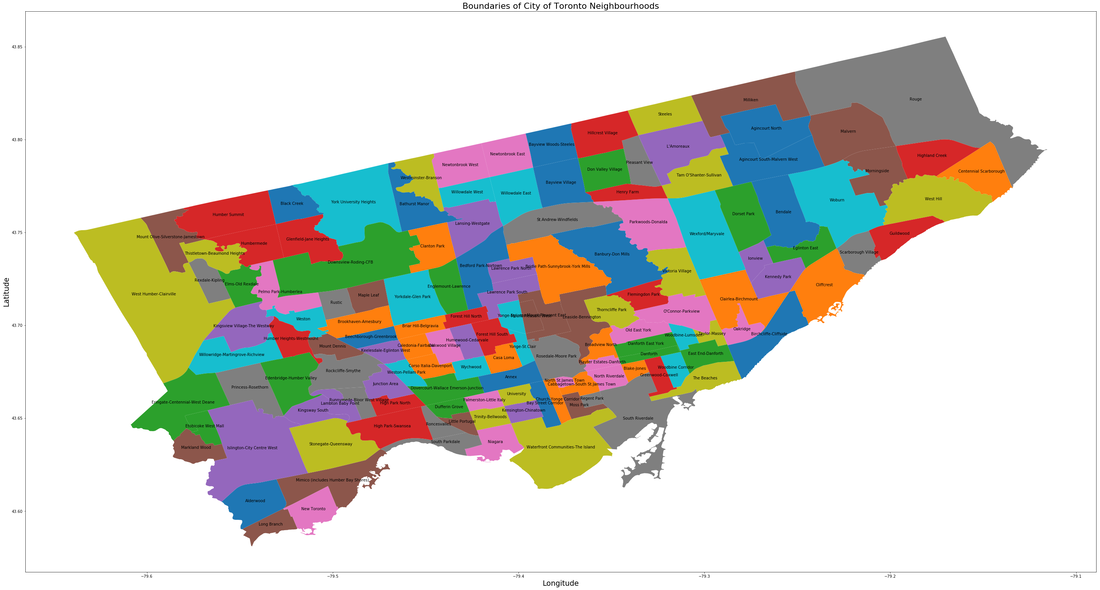
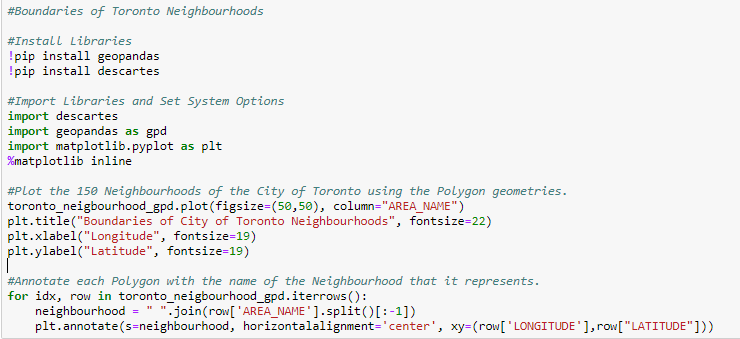
The following is the python code used to generate the annotated map above of the 150 neighborhoods of the City of Toronto.
ALL SCHOOLS WITHIN CITY OF TORONTO:
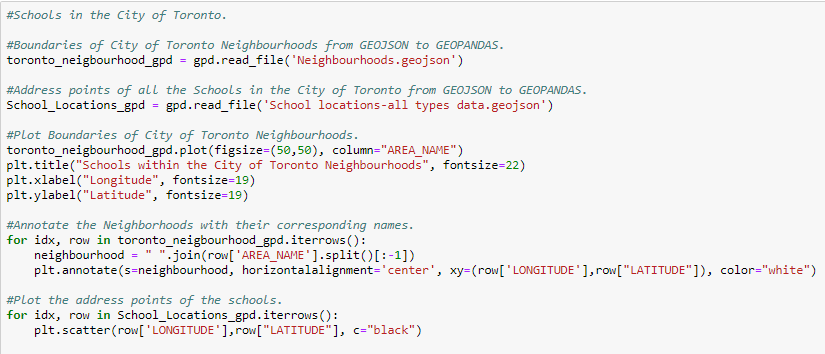
A geographical spatial (GEOJSON) file containing the address points of all of the schools within the City of Toronto was also obtained from Toronto's Open Data Portal. These points were plotted on the existing plot of the 150 neighborhoods of the City of Toronto. The following is an enhanced plot showing this additional information followed by the Python code used to generate it.

FROM FOLIUM TO INTERACTIVE LEAFLET MAPS:
Python has a very handy library called Folium that allows Data Scientists to create Interactive Leaflet Maps that can be outputted as separate HTML files. The two GEOJSON files containing the boundaries of City of Toronto Neighborhoods and all Schools in Toronto can be used to create Choropleth layers to be added to an Open Street Map. The following is the output generated from using python's Folium library to create a layered map containing first the Boundaries of City of Toronto Neighborhoods and then all Schools in those Neighborhoods.
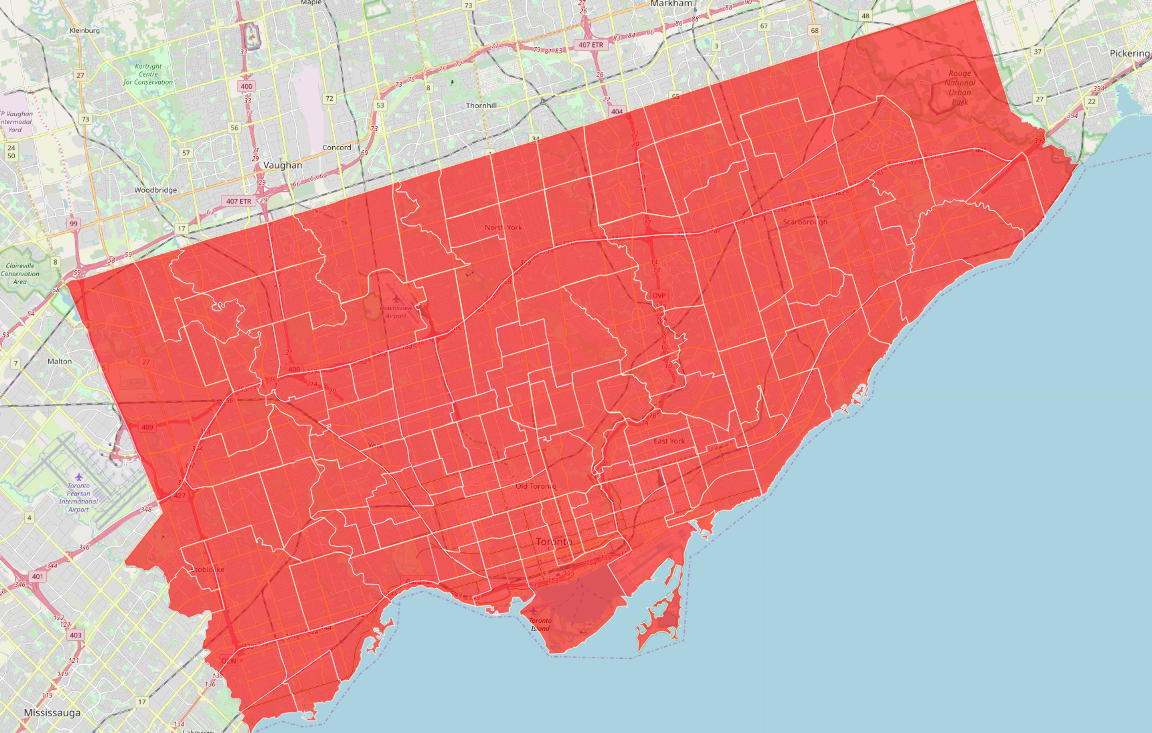
Boundaries of City of Toronto Neighborhoods
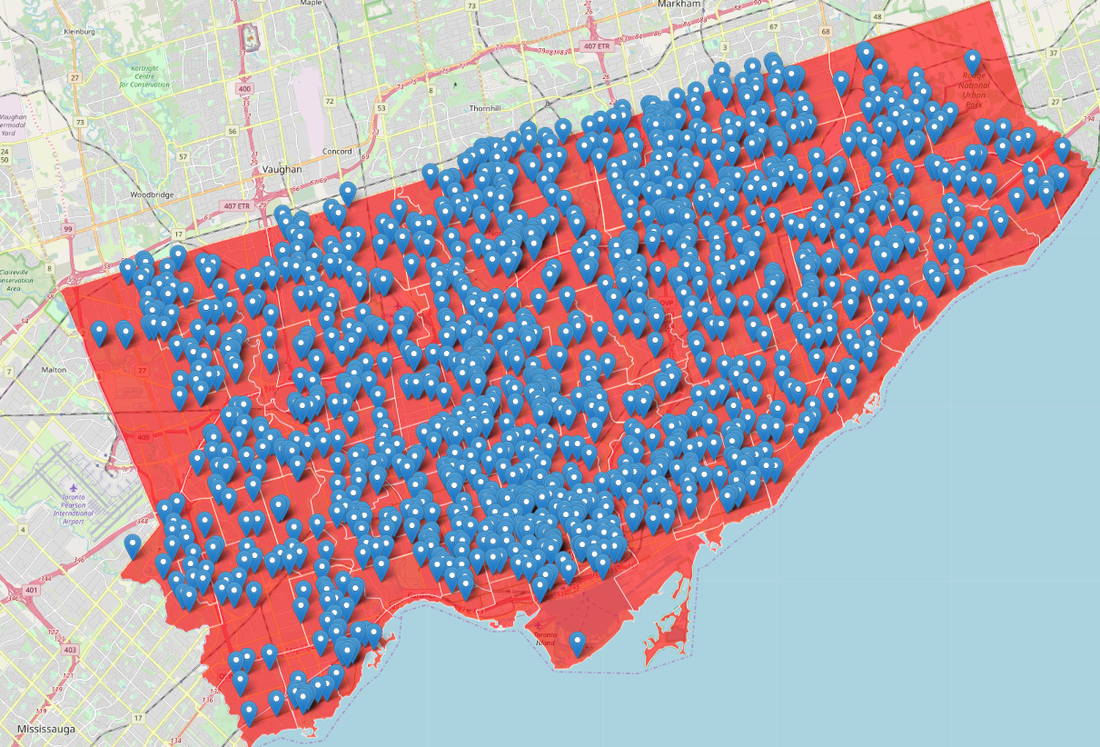
All Schools in the City of Toronto Neighborhoods.
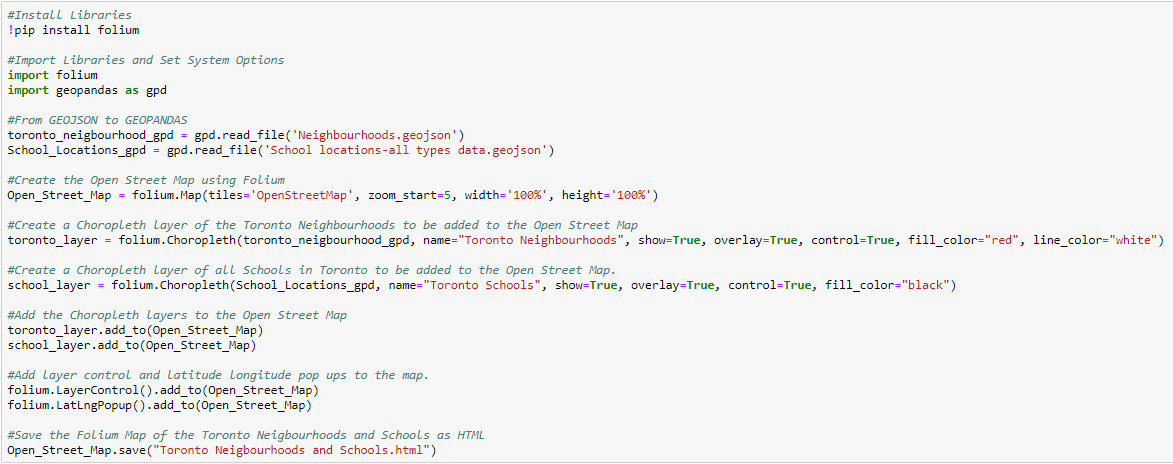
Python code used to generate the two maps above.
CONCLUSION:
Python contains many useful libraries for working with Geographical Spatial data such as GEOJSON files. One such library is GEOPANDAS which can be used to generate plots of Geospatial Polygons. Another library is Folium which can be used to create Interactive Leaflet Maps which can then be saved as HTML files. The possibilities are endless when using Python for Data Science.
Happy Learning!
 RSS Feed
