VANAUDEL ANALYTIX
Follow Us
  • Home
  • About
  • Python Blog
  • SAS Blog
  • Open Data Science
  • Consulting
  • Contact

Time Series Graphs for the PAN AM Games.

8/11/2019

0 Comments

 
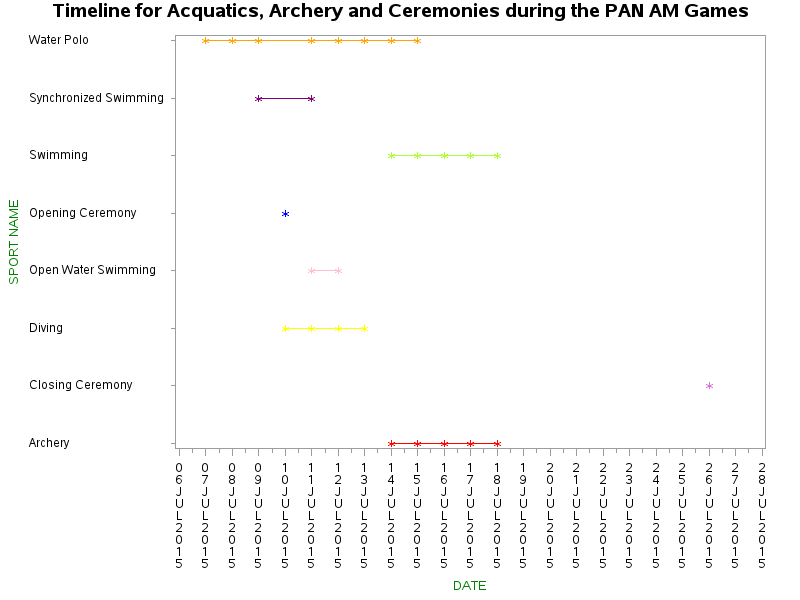
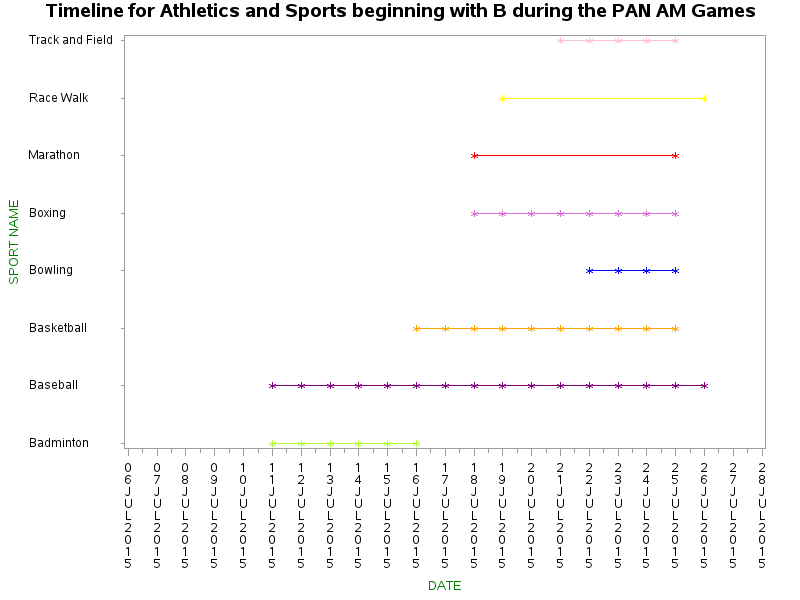
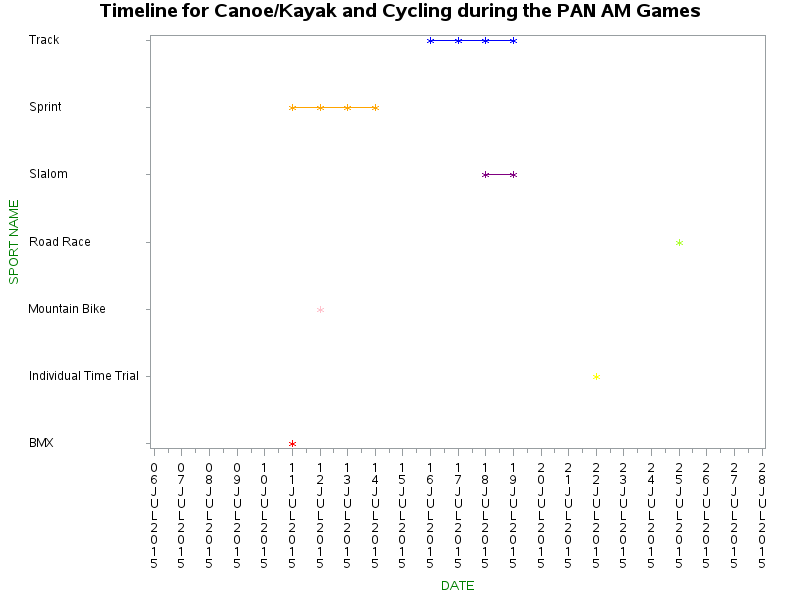
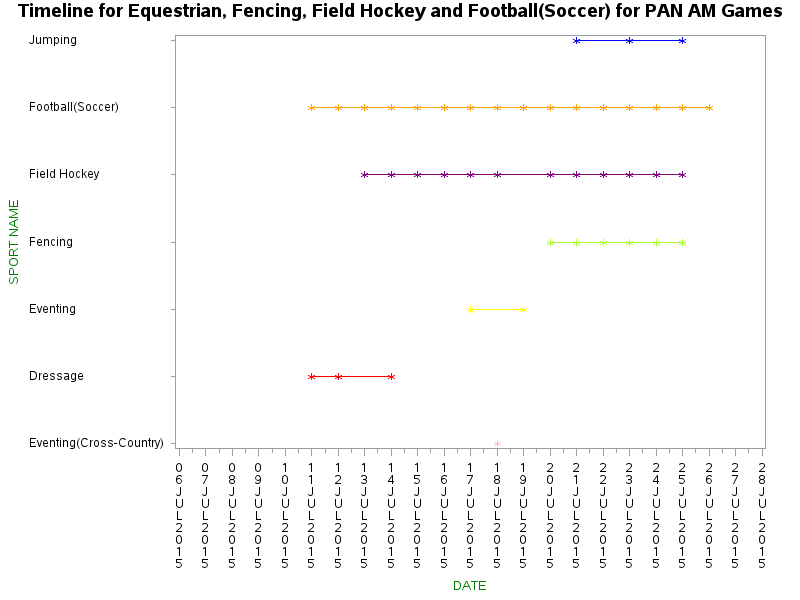
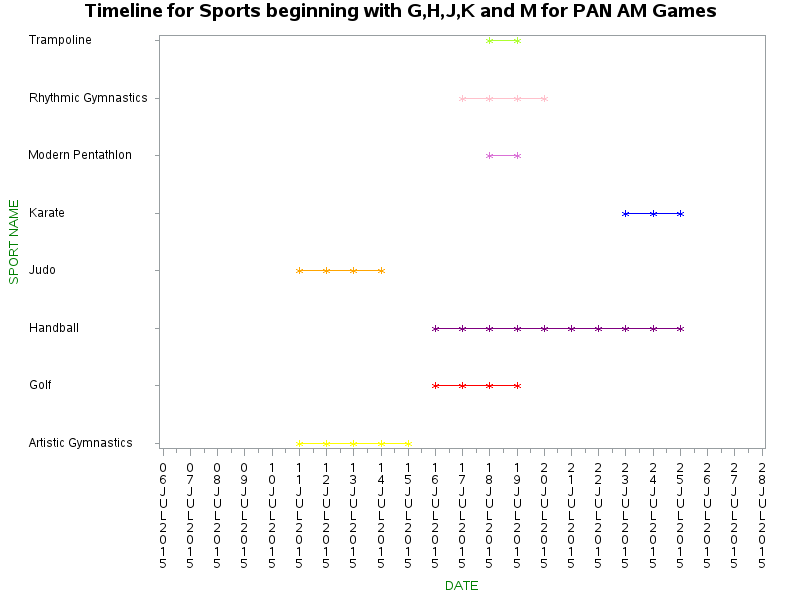
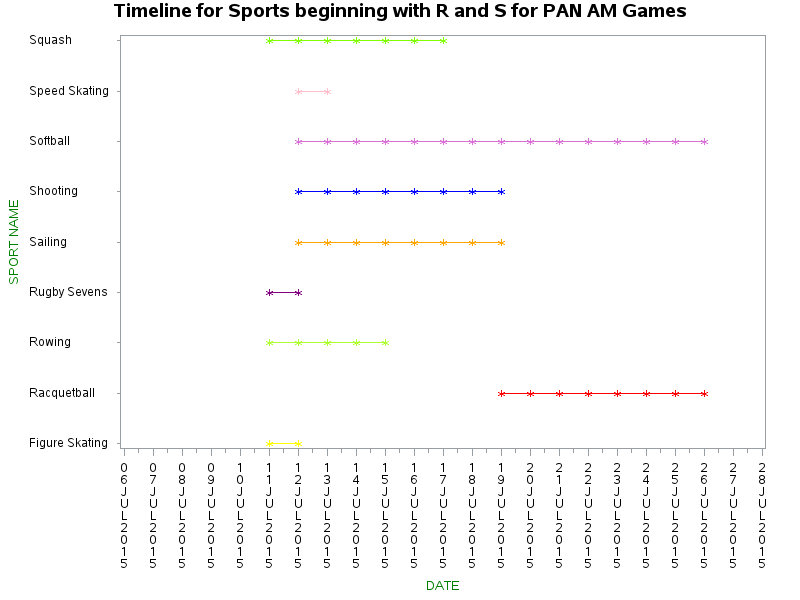
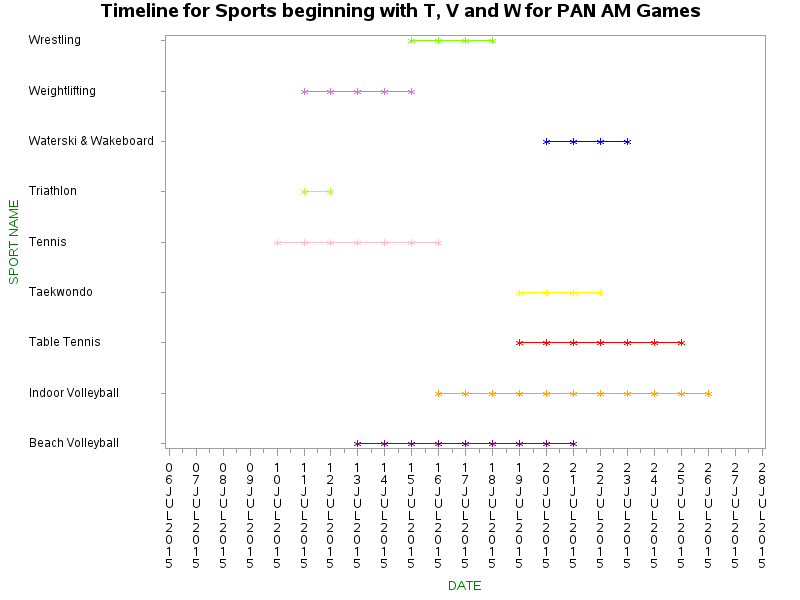
These Time Series Graphs give a visual picture of the Time Line of all the Sports at the PAN AM Games. The vertical y-axis shows the Sport Names while the horizontal x-axis shows the dates which run from July 6th 2015 to July 28th 2015.
Picture
Picture
Picture
Picture
Picture
Picture
Picture
0 Comments


Leave a Reply.

    Author

    My name is Vanessa Afolabi also known as @TheSASMom. I am a Data Scientist fluent in SAS, R, Python and SQL with a passion for Machine Learning and Research.

    Archives

    August 2019

    Categories

    All

    RSS Feed

Powered by Create your own unique website with customizable templates.